|
|
|
|
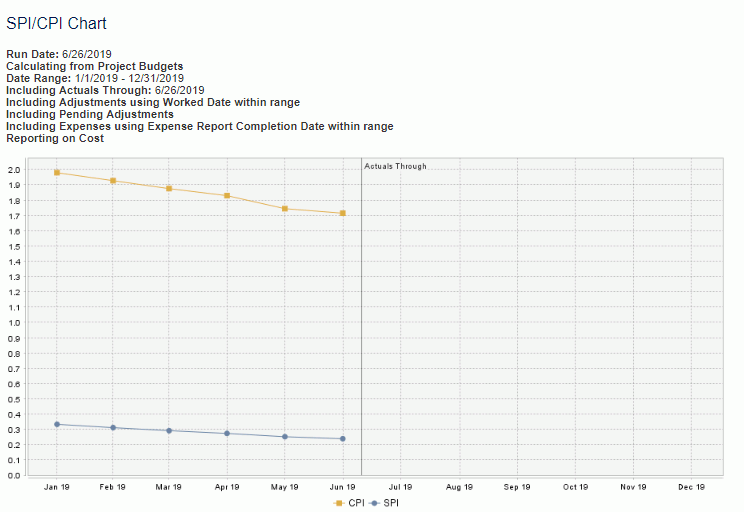
This chart can be run to provide a graphical representation of project / task SPI (Schedule Performance Index) and/or CPI (Cost Performance Index) information in a weekly, monthly or yearly interval.
CPI = BCWP/ACWP (Earned value over actuals)
SPI = BCWP/BCWS (Earned value over budgets)
Note that any unit of work with a %Complete > 0 has an earned value forever, unless there is a budget snapshot entry that states that the unit of work has a %Complete that is zero or calculates as a %Complete that is zero.
Click Through for Details
This chart does not currently support any click through capabilities.
This report is available to users having any of the following roles: Administrator, P&R Administrator, and the following Project Administrator roles (Project Manager, Project Viewer, Project Lead, Project Approver, or Resource Requestor) that also have one of the following roles: Bill Rate Manager or Cost Rate Manager.
This report is available with the Project Portfolio family of licenses.
Topics covered on this help page include:
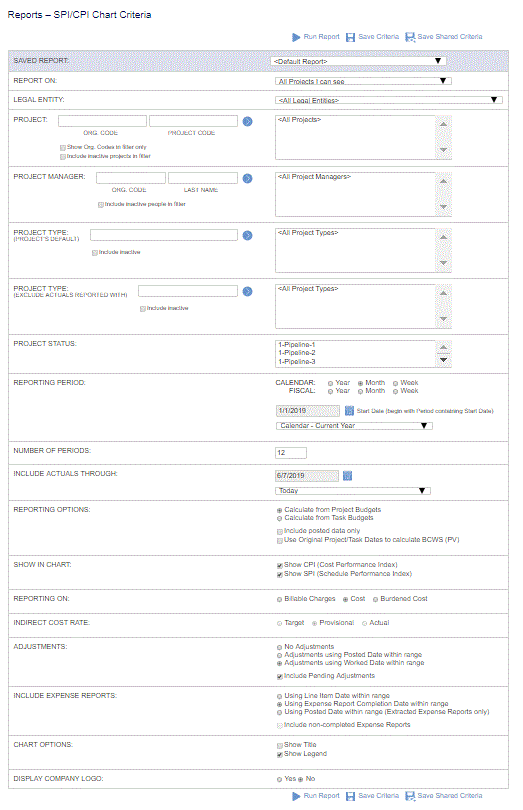
Selection Criteria (options available to tailor chart output)
You may also be interested in:
Dashboard Management (charts can be added to one of your dashboards)

|
|
|
