|
|
|
|
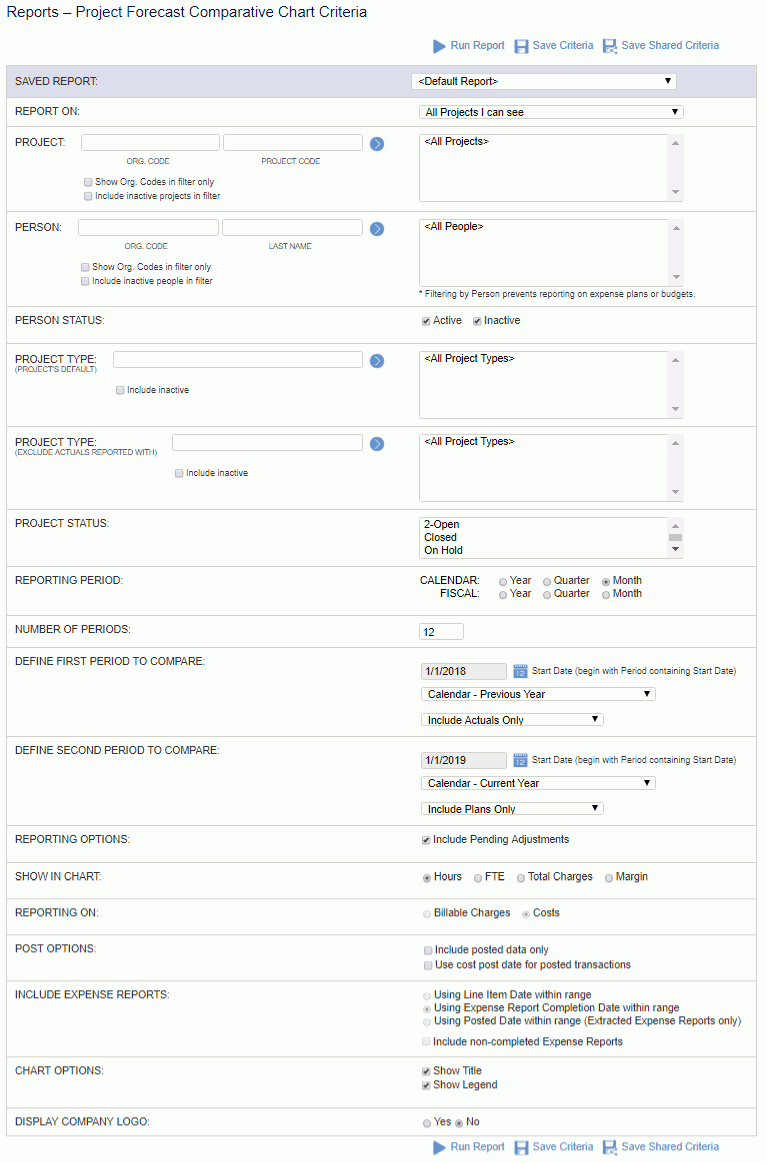
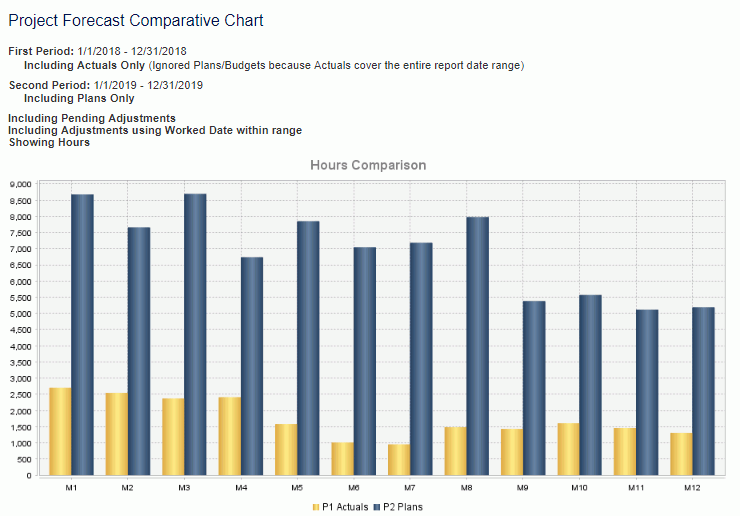
This chart can be run to provide a forecast of cost or revenue information in a Monthly, Quarterly or Yearly bar chart format - comparing two periods. The chart can optionally be run with Budget (aka Assignment) or Plan information, and can also optionally include Actuals through a particular date. Each bar in the chart can represent Hours, FTE, Margin or Total Charges for that period. If actuals are included, the report includes financial document labor, expense, and item transactions.
Click Through for Details
You can click on a bar within the chart to run a Forecast report for the one period represented by the bar, showing one line per project that contributed to the period's metrics.
This report is available to users having any of the following roles: Administrator, P&R Administrator, and the following Project Administrators: Project Manager, Project Viewer, Project Lead, Project Approver, or Resource Requestor.
Project Administrators that do not have the Bill or Cost Rate Manager roles can have access to the margin options when the Allow Project Margin Reporting for Non-Cost Rate Managers (unanet.non_cost_mgr.allow_project_margin_reporting) property is enabled.
This report is available with the Project Portfolio family of licenses.
Topics covered on this help page include:
People Forecast ReportSelection Criteria (options available to tailor chart output)
You may also be interested in:
Dashboard Management (charts can be added to one of your dashboards)

|
|
|
