|
|
|
|
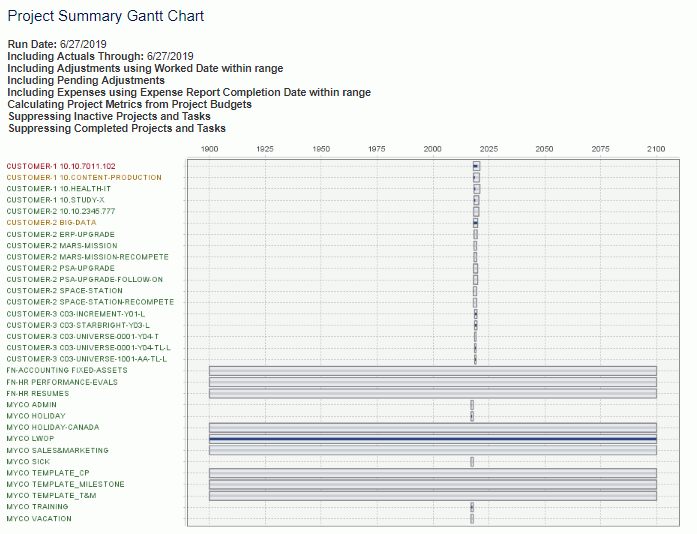
The Project Summary Gantt chart feature allows for a graphical representation of one or many projects, showing their date range and % complete. This chart will only include projects that have both a start and end date populated. The date range of the entire chart will be based on the minimum and maximum project dates in the included projects.
The dark blue line running through the center of a bars represents the % complete value for a project (as keyed in by the project manager or estimated if not provided). Each project code will also appear in the color associated with their project condition.
Click Through for Details
You can click on a bar in the Gantt chart which will bring you to the project profile for that specific project.
This report is available to users having any of the following roles: Administrator, P&R Administrator, and Project Administrators.
This report is available with the Project Portfolio family of licenses.
Topics covered on this help page include:
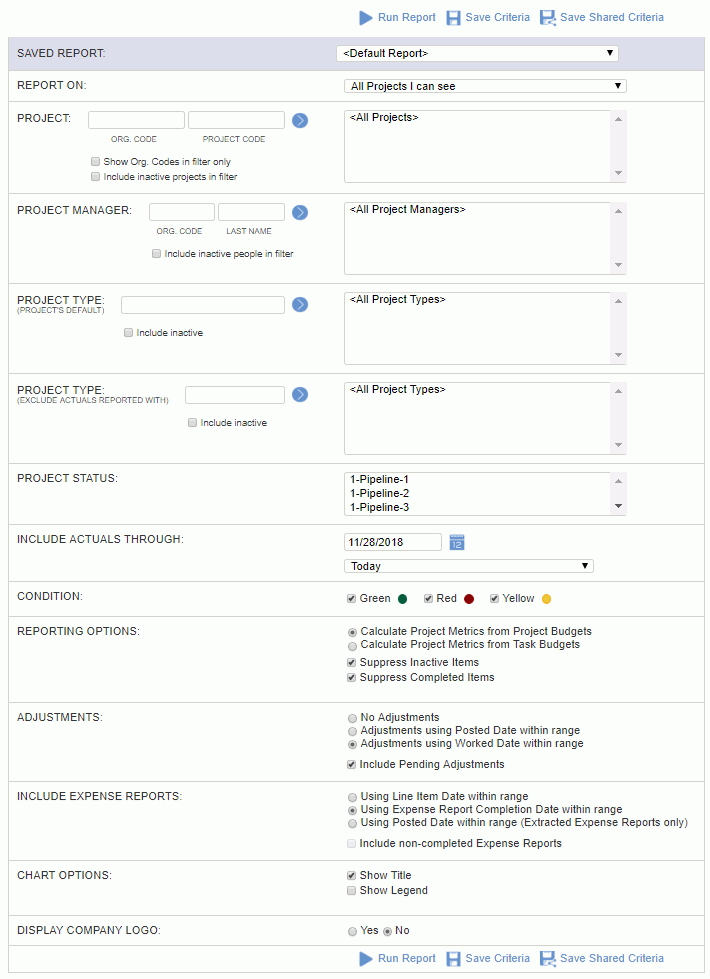
Selection Criteria (options available to tailor chart output)
You may also be interested in:
Dashboard Management (charts can be added to one of your dashboards)

|
|
|
