|
|
|
|
The ad hoc report facility is available for users with various roles to create and save custom reports. Using this tool, you will be able to create basic tabular reports. Once created, you will have the option of running or saving these reports. Saved ad hoc reports will appear on your dashboards in the My Reports section (in the left column). Report definitions can be shared via an export / import mechanism, and report output can be easily saved in a csv format (facilitating further spreadsheet manipulation of the report results).
This feature cannot currently create Matrix types of report output nor can it combine time and expense data on a single output.
Topics covered on this help page include:
Sharing Report Definitions (Importing and Exporting)
Dashboard Links (to ad hoc reports)
You may also be interested in:
FAQ - Is there a way to have an Adhoc Report break on a value and show a count of rows in each section? (search for this topic in the Knowledge Center)
Quick Topic - How to Replicate an Adhoc Report in a CDW (search for this topic in the Knowledge Center)
Users having the following roles will have access to the Ad-hoc Reporting facility:
Administrators and P&R Administrators will have access to all data areas
Managers and HR Administrators will have access to the People data areas
Project Administrator roles (with the exception of Customers, Resource Assigners, and Resource Planners) will have access to the Project data areas
Users that have only a Timesheet, Expense or UnaSource user role will not have access to this functionality.
Note that the standard data security / visibility mechanisms are also enforced with ad hoc report data. Check out the Restrict View help page for additional information.
To create an ad hoc report, navigate to the Reports >> Ad hoc menu option and simply click on the (![]() ) ad hoc report add icon. This will present you with a number of screens where you will need to specify the type of data you are interested in (data view / area), which columns are to be included in the output, any sort order, filtering or summarizing you are interested in.
) ad hoc report add icon. This will present you with a number of screens where you will need to specify the type of data you are interested in (data view / area), which columns are to be included in the output, any sort order, filtering or summarizing you are interested in.
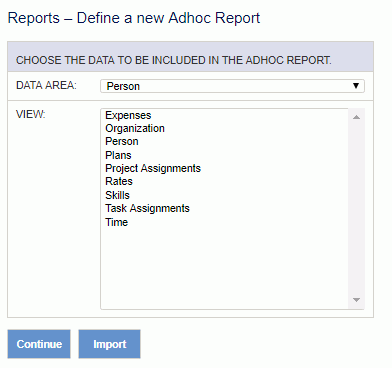
After clicking on the add icon, the user will be presented with the Define a new Ad hoc Report screen. On this screen you will specify which type of data you will be reporting on. Once you have specified a Data Area and particular View, click on the Continue button to take the next step in defining your ad hoc report.
|
|
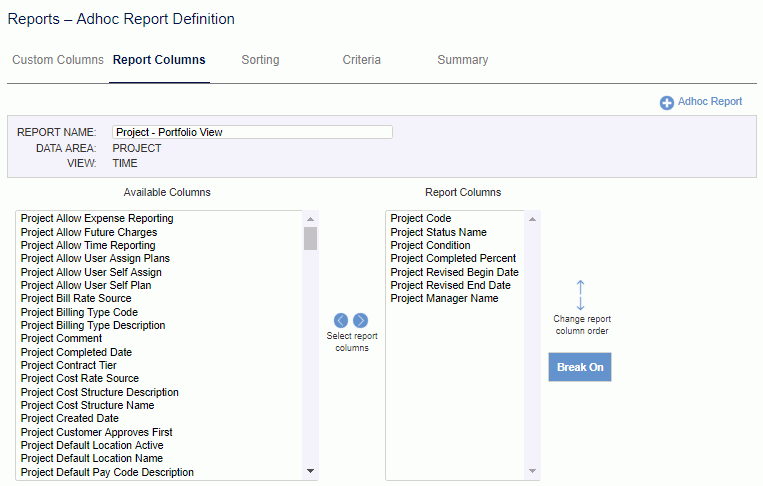
Once you have specified a Data Area and particular View, you will be presented with several additional tabs, the first of which is the Report Columns tab. This is the only tab that requires input (i.e., you must select something to display on the report).
You can click on the Run, Save or Export buttons from any of these tabs.
To add new columns to your ad hoc report, select one or many entries from the Available Columns field and click on the right arrow button. Once the desired columns have been moved into the right window (Report Columns), you can further control the order of the columns by selecting specific fields and clicking on the Move Up or Move Down buttons.
Similar to adding report column entries, in order to remove entries, simply select the desired items in the Report Columns window and click on the left arrow button.
At any time you can click on the (![]() ) ad hoc report add icon, which will abort the creation of the current report and return you to the Data Area / View screen.
) ad hoc report add icon, which will abort the creation of the current report and return you to the Data Area / View screen.
In order to include a summarized / aggregate / sub-total value rather than the individual detail values, you can highlight a particular field and click on the Break On button on the Report Columns tab. When doing so, you will notice several changes. That field and all fields above it will become grayed out. Those same grayed out fields will automatically appear in the Sorting tab as the first columns to be sorted (this order will be enforced and you will not be able to manipulate those fields on the Sorting tab).
The field that you have identified with the Break On button will also have a special character as the initial character ( § ).
All other fields above any Break On fields will have another special character that appears as a single dot ( · ) preceding the field to help identify that it will be automatically included in the sort (as some browsers will not display the grayed out background).
Note that you can identify one or more fields as being aggregated by clicking the Break On button on more than one field. Clicking on a row that has previously been designated as a Break On field will toggle / unselect the field as being included in a grouping / summary.
|
|
|
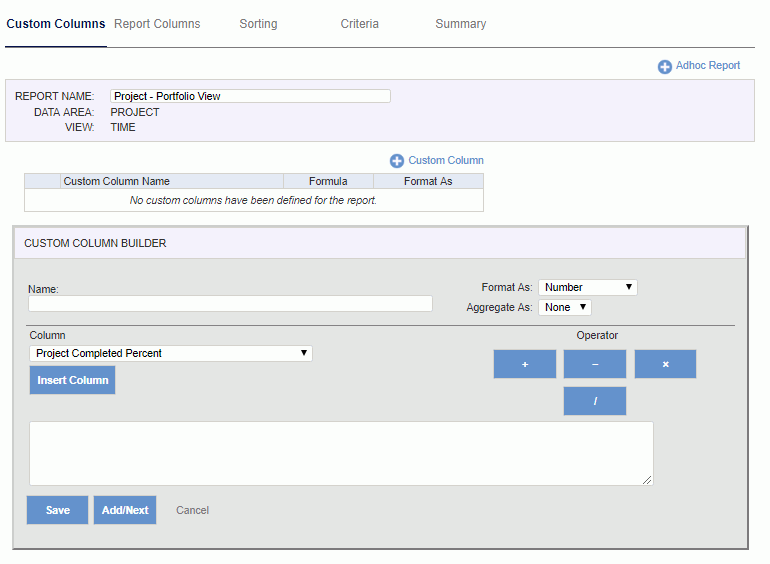
The Custom Columns tab is available for you to construct your own columns that may be included in the report output or otherwise used in the sorting or filter criteria. Once you have created a custom column and given it a name, you will see that new column name appear in the other tabs.
The upper portion of this screen will display a listing of any custom fields that you have previously defined within this ad hoc report. You can use the add (![]() ) icon to expand the Custom Column Builder (lower) section of the screen, where you can edit the details for a specific column. Existing columns can also be revised by clicking on the edit pencil, or removed using the delete icon. Note that removing a custom column will also remove it as being available in the other ad hoc report tabs.
) icon to expand the Custom Column Builder (lower) section of the screen, where you can edit the details for a specific column. Existing columns can also be revised by clicking on the edit pencil, or removed using the delete icon. Note that removing a custom column will also remove it as being available in the other ad hoc report tabs.
You can create custom columns that include basic formula and aggregate functions, and you will have several basic options for formatting the resulting output.
To use the specify a Name for the Custom Column Builder, custom field, select a field from the Column drop-down and click on the Insert Column button. You can use the Operator button to insert basic operator symbols and continue adding additional fields to the formula. The Format As and Aggregate As options will further define your custom column. Once you have defined and saved your custom column, a summary will appear in the upper section of the screen and the field will be available for use on other ad hoc report tabs.
|
|
|
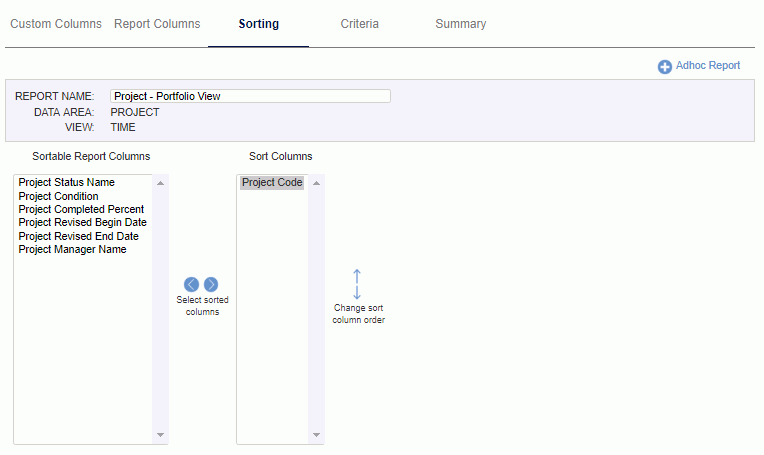
Once you have specified which columns will be included in the ad hoc report, you can further define how the output will be sorted on the Sorting tab. The sort order will be determined by those columns you place in the Sort Columns field, beginning with the field at the top of that list on down. All sorting based on this screen will be in ascending order.
Note that when you have specified aggregated values using the Break On button on the Report Columns tab, those values will automatically appear as selected Sort columns and will be the first columns in the sort order. You cannot further manipulate the order of those columns from this tab.
You can click on the Run, Save or Export buttons from any of these tabs.
To add new columns to your sort criteria, select one or many entries from the Sortable Report Columns field and click on the right arrow button. Once the desired columns have been moved into the right window (Sort Columns), you can further control the order in which the columns will be sorted selecting specific fields and clicking on the Move Up or Move Down buttons.
Similar to adding report column entries, in order to remove entries, simply select the desired items in the Report Columns window and click on the left arrow button.
At any time you can click on the (![]() ) ad hoc report add icon, which will abort the creation of the current report and return you to the Data Area / View screen.
) ad hoc report add icon, which will abort the creation of the current report and return you to the Data Area / View screen.
|
|
Using the Criteria tab, users can provide additional criteria to further filter the report output. You can include filtering criteria for both those columns that appear in the output as well as those not in the output. By inserting additional rows, you can enter as many criteria as you like. Note that each of the entered criteria are "AND'd" together (e.g. filter 1 AND filter 2 AND filter 3). A future release of Unanet may contain an "OR'ing" capability.
Review the on-screen Criteria Hints for additional tips regarding formulating your criteria filter entries.

|
|
|
The Summary tab can be used to specify that an additional aggregate value be displayed for a particular column in the report output. Only numeric columns will be available in the Report Column listing. When one or more check boxes have been checked, one or more aggregate amounts will be included at the bottom of the corresponding column.

|
|
Once you have defined all of the report criteria you can run the report by clicking on the Run button. Alternatively, you can save the report and run it from either the Reports >> Ad hoc screen or via a Dashboard Quick Link. Regardless of how the report was initiated the output will be the same.
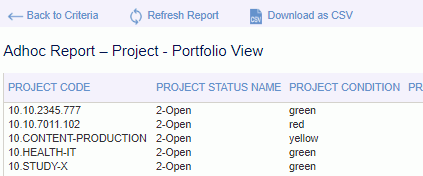
The report output will contain each of the specified columns in your report definition. The name you have supplied will appear in the report title bar.
Sorting
You can further sort the resulting output by clicking on any column heading. Clicking on a column heading will initially sort the report by that column only in an ascending order. Clicking on the same heading again will resort the report by that column in a descending order. Note that when you click on any heading the sort definition specified in the Sort tab will be ignored entirely.
Download as CSV
The Download as CSV link allows you to save the report output in a comma separated values format. This format can be conveniently opened in a spreadsheet program for additional data manipulation or shared with others as desired.
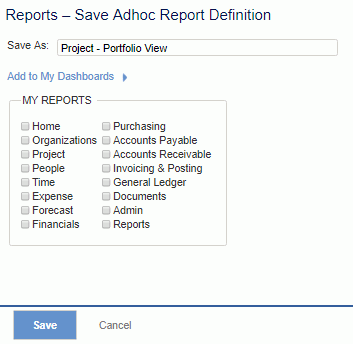
When working on any of the report definition tabs, you can click on the Save button, which will present the user with the following dialog box. The name you supply in the Save As field will appear in the list of ad hoc reports that appear on the Reports >> Ad hoc screen as well as on the various dashboard My Reports section.
In addition to supplying a custom name for your saved ad hoc report, you can also expand the collapsible "Add to My Dashboards" link, and check any Dashboards to which you would like this saved report to appear on. These reports will appear in the My Reports left menu list on each dashboard.
You can access a complete list of your saved ad hoc reports via the Reports >> Ad hoc menu option. Also note that via your Preferences >> Dashboard screens, you can make certain ad-hoc reports appear in your My Reports section to allow for one click execution.
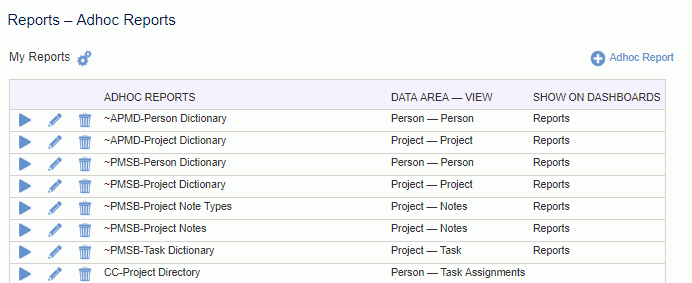
From this screen, you can:
Run the Report -- Clicking on the run report icon will execute the report, directly displaying the report output (bypassing the report definition screens).
Edit the Report Definition -- Clicking on the edit icon will display the associated report definition screens with your custom values populated.
Delete the Ad hoc Report -- Clicking on the delete icon will remove the ad hoc report from your system.
Show on Dashboards -- This column will reflect which dashboards you have chosen to include this report in your list of My Reports. Clicking on the  link is a short cut to the Preferences >> Dashboard (My Reports tab) where you can manage which Ad-hoc Reports will appear in your My Reports listing (by dashboard).
You can share a particular report definition with other users via the Export / Import capabilities. Once you have a report defined as you would like, you can click on the Export button which is available on any of the report definition edit tabs (e.g. Report Columns, Sorting, Criteria, Summary). This will prompt you to save a file (in XML format), which can then be shared with another user.
The receiving user can load a shared report into their list of ad hoc reports by clicking on the add ad hoc report icon (available on the Reports >> Ad hoc screen), and then rather than selecting a Data Area and View, click on the Import button (and selecting the provided file).
Note that if the original author had permission to see data areas, views, or columns that the receiving user does not have permission to see, the import process will continue to load the report, dropping any of the columns in questions. For example, if the initial report creator possessed the Cost Rate Manager role and had included Cost Rate related fields, yet the receiving user did not have that role, any Cost Rate related fields would be dropped from the report definition when imported for that user.
Ad hoc reports can be configured to appear in the My Reports section of various home pages. Clicking on one of these links will execute the report with the custom criteria, directly displaying the report output (bypassing the report definition screens). Configuring an ad-hoc report to appear on a particular dashboard can be accomplished via the Preferences >> Dashboard >> My Reports tab.
