|
|
|
|
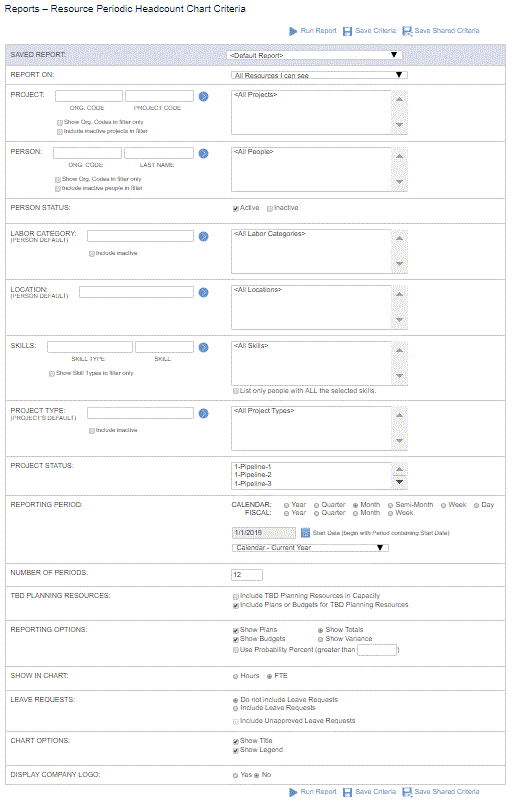
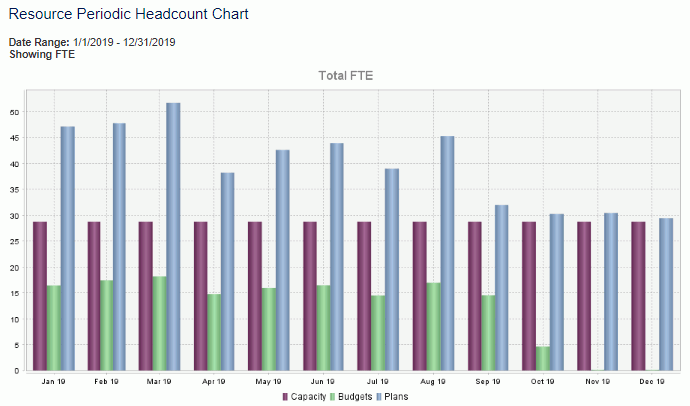
This chart is intended to facilitate the analysis of future capacity in terms of plans, budgets (and can optionally add requested leave on top) and their variance in a Daily, Weekly, Semi-Monthly, Monthly, Quarterly or Yearly bar chart format. Using the available selection criteria, you can determine whether the output will include plans and/or budgets, whether the amounts will reflect totals or variance, and the output can reflect either Hours or FTEs (full time equivalent).
Note that when showing plans/budgets the chart will include ALL plans/assignments for a person, regardless of the permissions of the user running the report.
Click Through for Details
You can click on a bar within the chart to run a Periodic Headcount report for the one period represented by the bar.
This report is available to users having any of the following roles: Administrator, P&R Administrator, Resource Planner and Resource Assigner.
This report is available with the Project Portfolio family of licenses.
Topics covered on this help page include:
Selection Criteria (options available to tailor chart output)
You may also be interested in:
Dashboard Management (charts can be added to one of your dashboards)

|
|
|
